Project Portfolio
Hello! Welcome to my project portfolio*. Below are some projects ranging from my Master’s degree capstone to some information about work I did in Industry.
- Masters Capstone Project: Working with Telecommunications Network Data and geospatial IoT data
- Magic The Gathering Project: Web-scraping a dataset and doing a Natural Language Processing analysis
- Hadoop Map Reduce: Developing python map reduce scripts to solve classic computer science problems in AWS
- Distributed Queries on Hadoop: Using the PIG scripting language to answer questions about a Kaggle dataset
- Blog Post about CBM Work in Automotive Industry: Solving Predictive Maintenance and Condition Based Maintenance problems for an automotive manufacturer
Brief Intro:
My name is Maggie Conroy. I have been working in the Information Technology field for over a decade, with much of that time spent managing data. I began at an insurance company and helped to migrate a FoxPro database to SQL. From there, I took a role as a lead system administrator managing HP Unix, Red Hat Linux and Windows systems in a National Guard Data Center.
While working in the Data Center, I began working on a Master’s of Science in Data Science. During this program, I completed an internship at a telecommunications company in the Engineering department working with Radio Frequency (RF) Engineers and subject matter experts to analyze network quality and coverage.
After earning my Master’s degree in Data Science, I transitioned into Data Science as one of the first members of an R&D Data Science team embedded in the Engineering Department of an automotive manufacturer. This is where I cut my teeth on the end to end pipeline of IoT data—Building pipelines, managing the data after it landed and processing/modeling the data to provide value to the customer.
If you want to know more About Me and my Data Science Journey, feel free to check out my blog, or see my LinkedIn Profile and say Hi!
Masters Capstone Project
For my Master’s Degree capstone project, I developed use cases for a novel dataset and developed a dashboard for the most value-added use case: Providing Radio Frequency Engineers with a map estimating cell signal quality, network traffic volume, and service coverage by on a map to be used to assess network issues and future small-cell (5G) tower locations.
Google provided telcos with a dataset using cell quality metrics gathered via Location Services on Android phones. This dataset provided a view into network quality at a granular level that telcos couldn’t get otherwise due to FCC regulations.
I used K-means clustering and Hierarchical Clustering to estimate clusters of data based on quality and labeled them “Good” to “Poor”. Then, I visualized this information on an interactive R Shiny Dashboard using Leaflet for mapping.
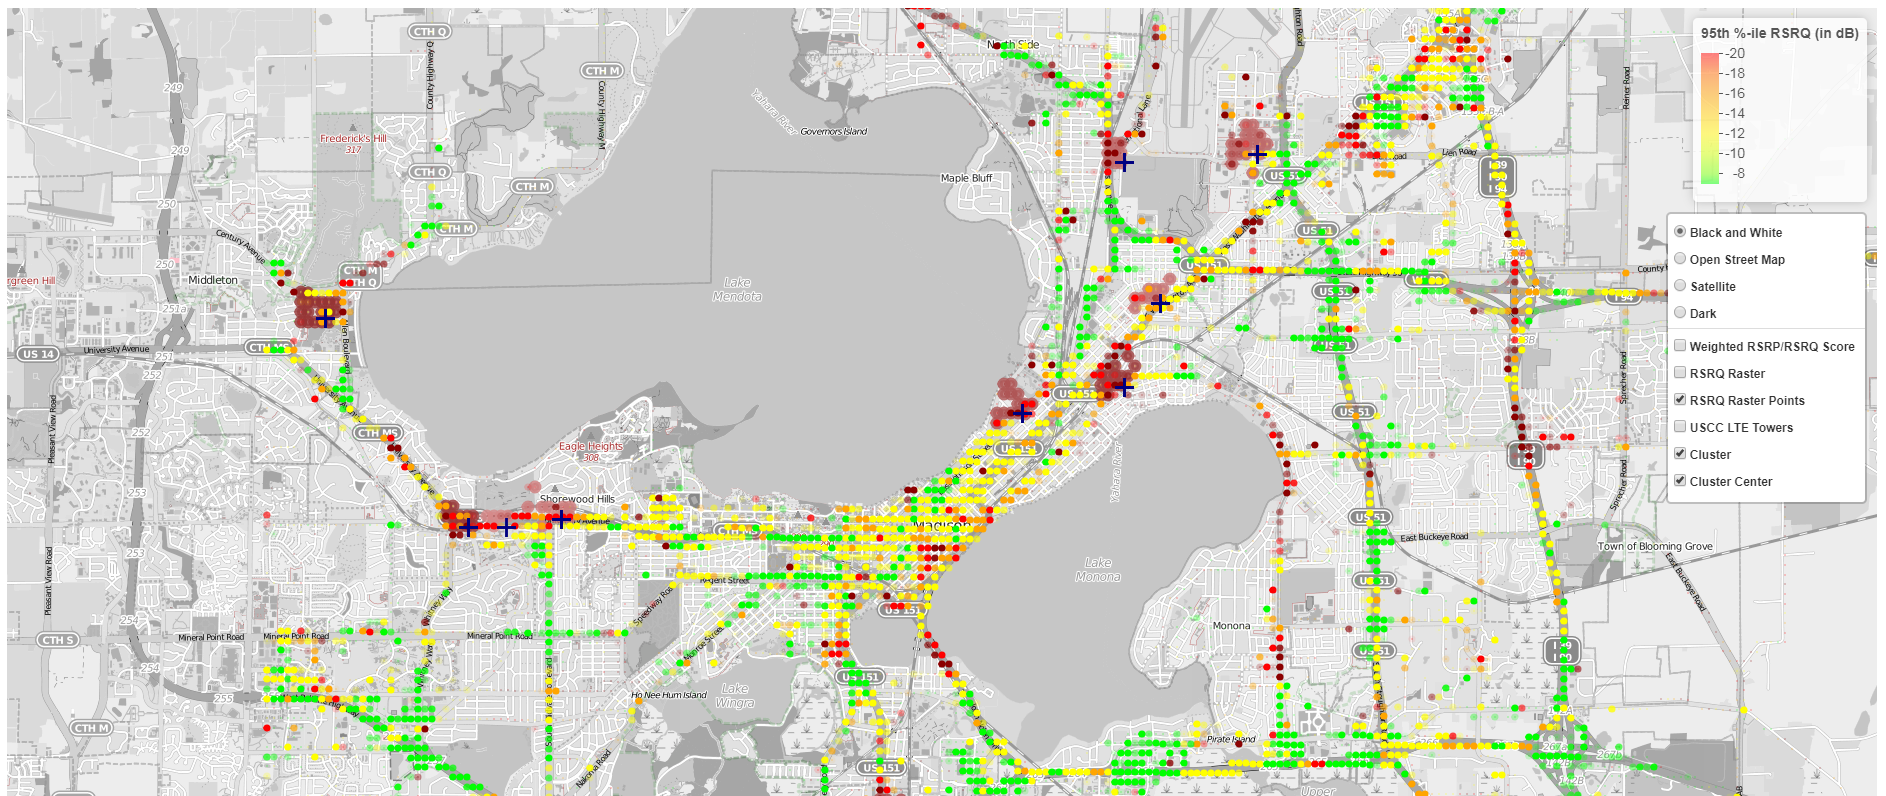
The Proof of Concept showed that the dataset could be used to identify areas of poor cell coverage in high-traffic areas. These maps could be used by engineers to investigate network coverage issues more precicely. They also provided an additional data point for planning future network upgrades.
Files
PDF Download of my Capstone Paper
Schweihs, Margaret. “Methods for Analyzing a Wireless Network via Customer Mobile Application Data,” 2018.
Appendix A: Technical Slidedeck “Insights from Application Data: POC for Small Cell Planning,” July 2018.
Personal/School Projects
MTG Card Text Analysis
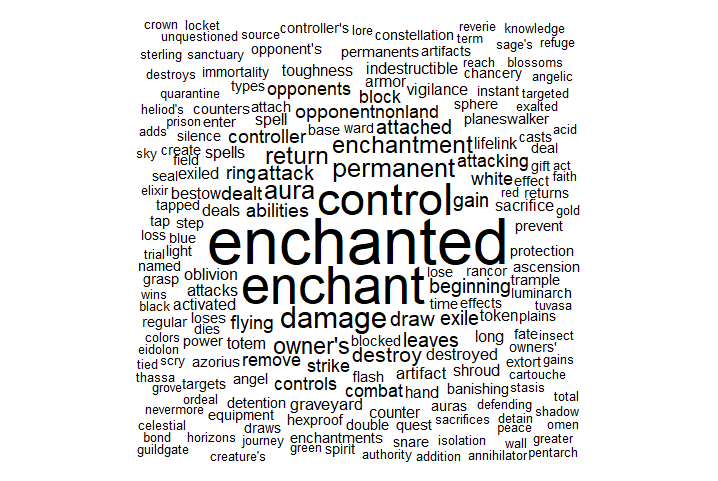
My family and I love playing Magic the Gathering, so I created this project for a final exam for an Unstructured Data Analysis Class during my Master’s degree program. The goal was to analyze the deck structure of the tournament decks in the current “meta” (a term used to describe the current cards in popular use). I also wanted to analyze the text on the cards since MTG card narratives contain a lot of interesting Fantasy-genre descriptions.
The project required scraping and structuring my own dataset from popular websites. I processed the raw data into a JSON format and enriched it using the official Magic the Gathering API. Then I applied NLP to the text on the cards and did some exploratory data analysis of the card and deck metadata.
Hadoop Map Reduce Project
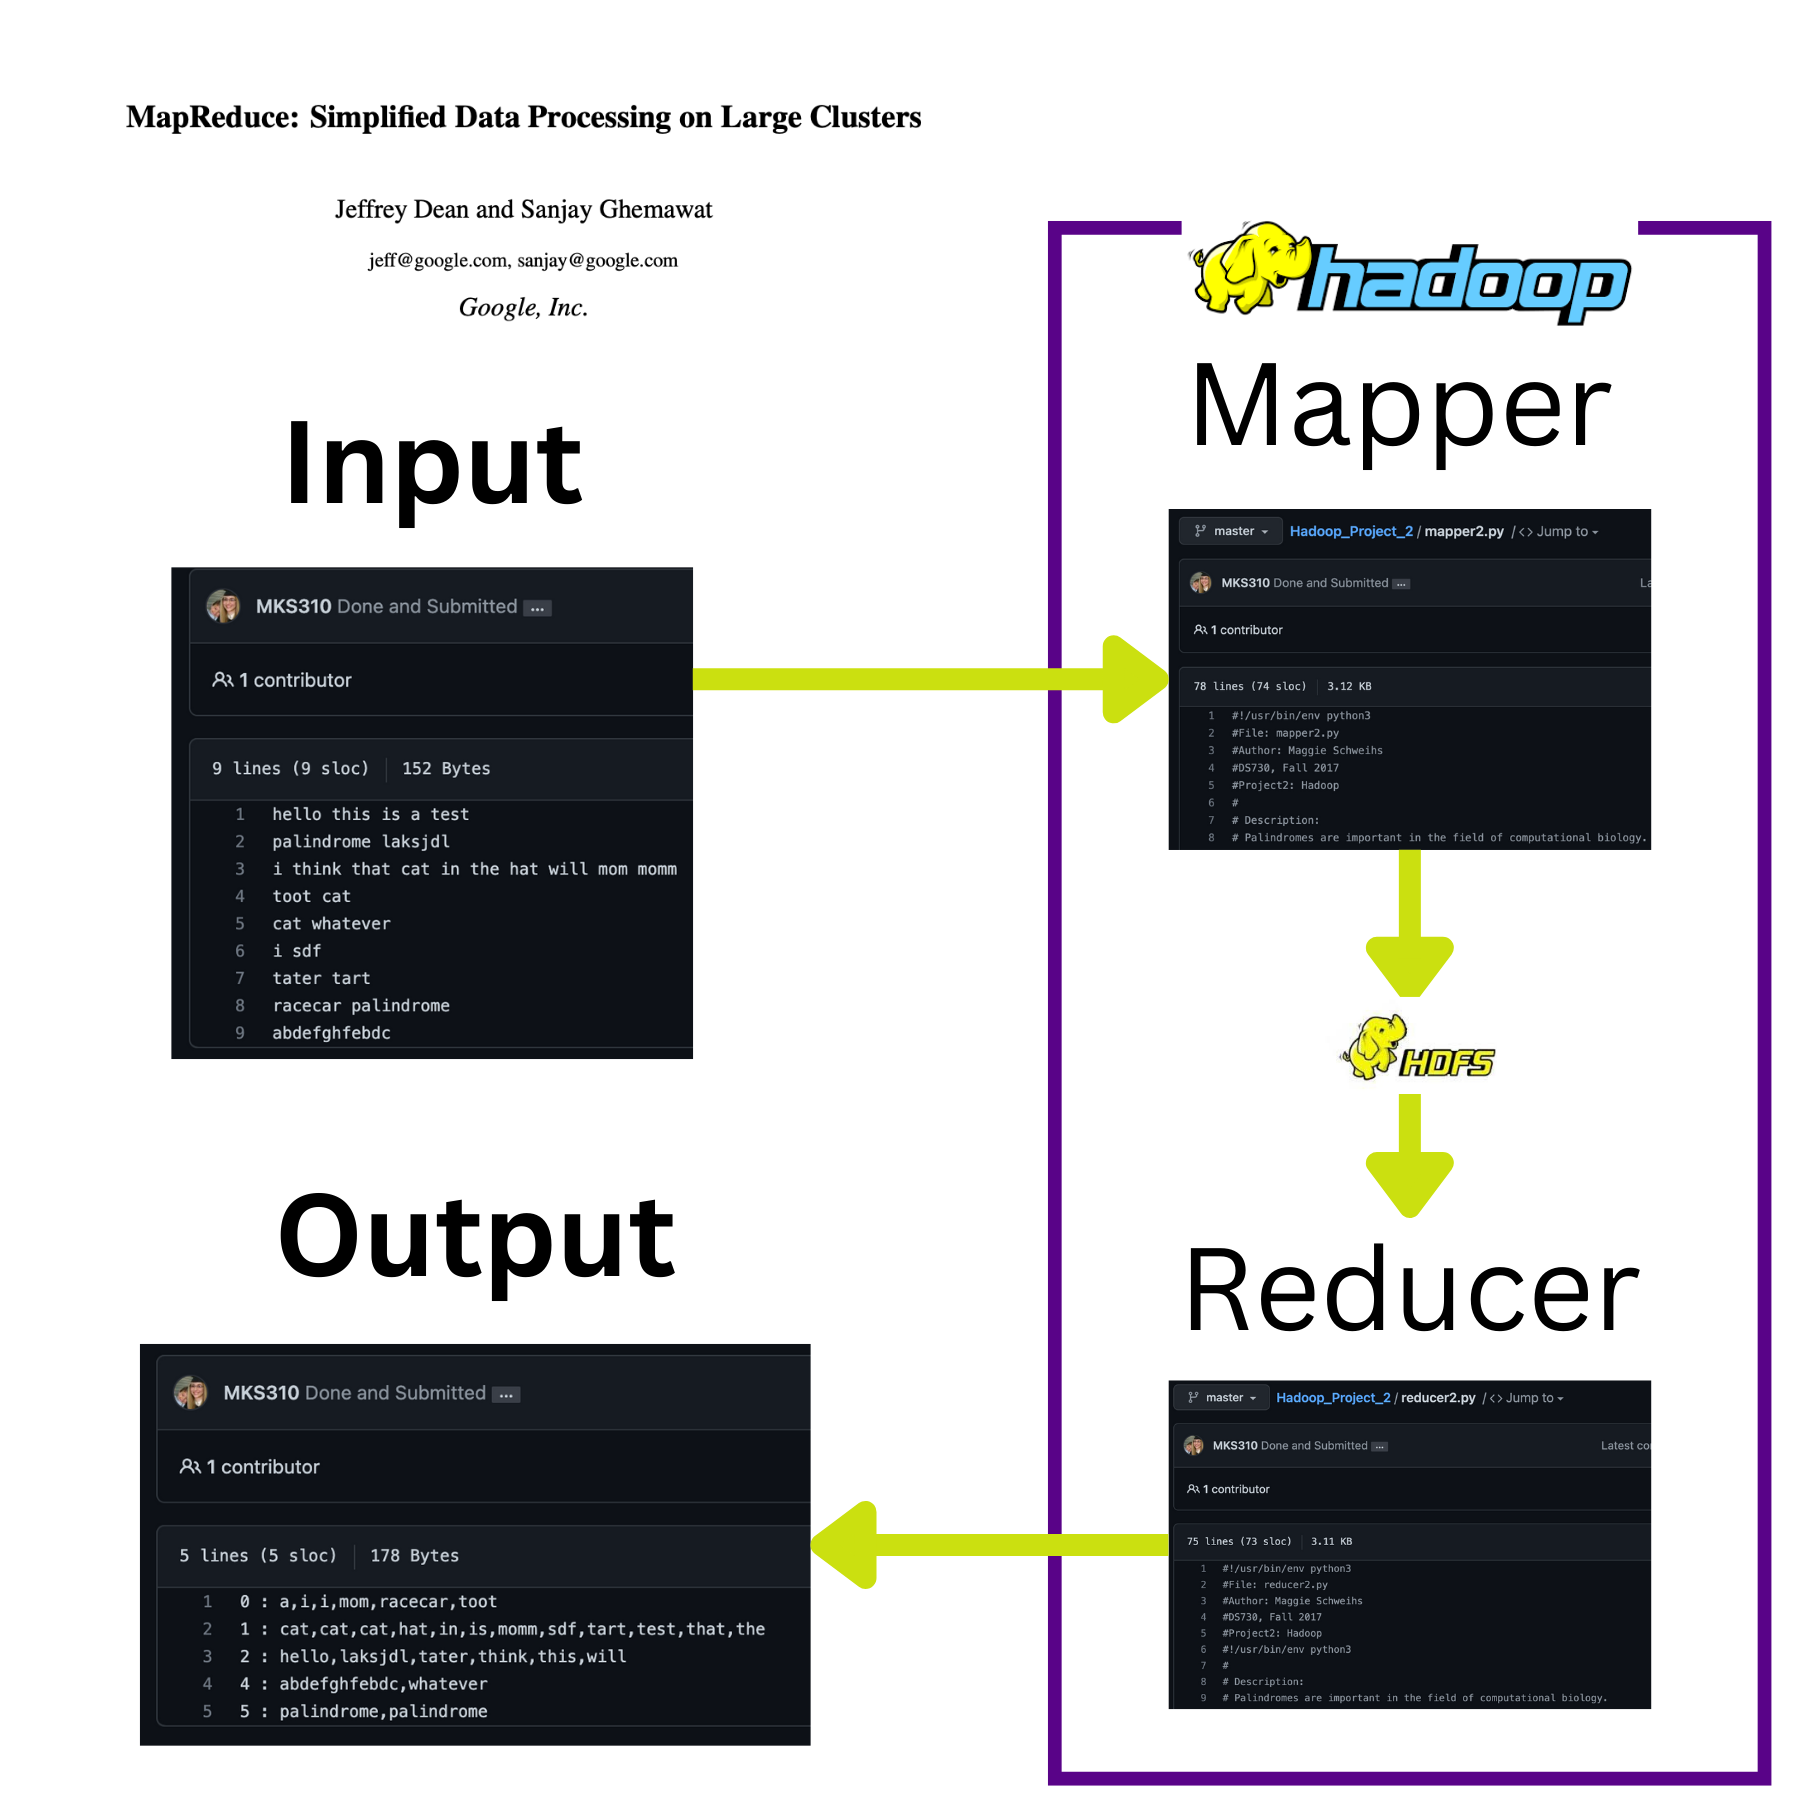
In this project, I worked with input, output, Python and the MapReduce framework.
Vietnam Bombing Kaggle Data Analysis
This project required using Pig scripts in a Hadoop environment on a large dataset. The task was to ask a 3 questions about a large dataset and answer them using the Apache Pig language.
With the analysis, I demonstrate how data-driven analysis requires domain knowledge and investigation. A Data Analysis is driven by questions and research into a topic.
I downloaded a kaggle data set containing declassified U.S. military bombing operation data from the Vietnam War. The data was declassified in 2000 by President Clinton. I wanted to compare the data that was reported in the media to the data in the dataset using Apache Hadoop and Pig.
Corporate/Industry Projects
I was a Data Scientist in the Engineering R&D Department of an Automotive Manufacturer for 3-years. Unfortunately, the code and work produced is all proprietary intellectual property owned by the company. However, these links point to the high-level descriptions of the accomplishments of myself and the team I worked with!
From the Blog Post about our work
1. Moving From Calendar-Based Intervals to Real-Time Predictive Maintenance
“At Oshkosh Corporation, engineering teams use Dataiku to create predictive maintenance analytics that save their customers time and money by keeping vehicles on the job and out of the shop. A great example of this is a routine oil change. Similar to a car, most heavy-duty vehicles typically use calendar-based scheduled intervals (e.g., every six months), without considering the historical operations and current oil quality. Through vehicle telematics data and condition-based maintenance (CBM) methods, oil degradation can be monitored and modeled to accurately predict a remaining useful life and prescribe appropriate actions. By triggering an oil change only when needed, customers avoid unnecessary maintenance actions that result in inflated materials costs and reduced vehicle availability.
“You need collaboration to do data science effectively in the first place. Dataiku facilitates and enables collaboration much better than anything else I’ve seen. It used to just be technical experts and data scientists, but now analysts and management can be involved side-by-side in the process.”
– Dr. Michael Schuh, Chief Data Scientist, Oshkosh Engineering
The actionable insights produced through CBM analytics projects in Dataiku have shown tremendous potential to disrupt the current maintenance paradigm for vehicle fleets in many markets. Early pilot program results show a potential 2-3x improvement in required maintenance intervals, which translates to more than a 50% reduction in downtime and support costs over the life of the vehicle. If extrapolated over the fleets of similar Oshkosh vehicles in operation around the world, this could result in thousands of labor hours and millions of dollars saved for their customers.
There are additional benefits to these analytical solutions, too. A clear win is the increased environmental sustainability via reduced use of hazardous materials such as oil — literally saving thousands of barrels of oil in the previous example. A more subtle benefit comes from reducing additional vehicle faults and failures that are often accidentally induced by performing maintenance actions, which would mean additional rework, time, and costs. Lastly, indicators from CBM models, operationalized through Dataiku, keep operators from running their vehicles to critical failures while in use, preventing additional incidents that could be potentially dangerous and much more costly to repair.”
From the Oshkosh Corporation Website:
The concept for Condition Based Maintenance is to continuously assess actual vehicle condition through sensors, observations, and portable devices to provide evidence maintenance is needed. While CBM establishes the ability to measure vehicle conditions, CBM+ provides recommendations for optimizing maintenance schedules and strategies with the overall goal of reduced life cycle costs and improved readiness.
Oshkosh has applied CBM and CBM+ methodologies to numerous defense platforms including UK WT, FMTV A1P2, PLS, and JLTV in addition to Commercial fleets including JLG® Lifts, Pierce® Fire Trucks, and McNeilus® Cement Mixers. Oshkosh is leveraging the capabilities established as a whole to advance CBM technology and predictive and prognostic applications within all Oshkosh products.
Oshkosh is committed to advancing CBM and CBM+ technologies within the tactical wheeled vehicle community. Although CBM is mostly associated with vehicles, Oshkosh is also applying this capability to manufacturing equipment. As manufacturing technology continues to evolve, the importance of understanding equipment conditions becomes increasingly critical. Oshkosh has applied CBM to torque tools and programmable logic controllers to monitor critical conditions and conditions that are difficult to measure manually.